Saturday 28 May 2022

David Dineley RIP

David Dineley RIP 

I have just heard that David Dineley died on the 17th May. his funeral will be on the 7th or 8th of June.

I did not know David but knew he was a great friend of WEGA while he was head of the Bristol Department. 

He was a distinguished Bristol palaeontologist, who was a member of staff in the Department of Earth Sciences (= Department of Geology then) from 1968 to 1989, and was Chaning Wills Professor and Head of Department from 1968 to 1989. David Dineley is best known for his fundamental work on early fossil fishes and on Devonian stratigraphy, on which he wrote many scientific papers and books. 

When we know more, we will pass it on.


Wednesday 25 May 2022

Dinosaurs Lost, Mammals Won - How?

Dinosaurs Lost, Mammals Won - How? 

We all know that at the end of the Cretaceous dinosaurs became extinct and that mammals inherited the Earth. We know much about the extinction, less about the success of the mammals. 

A correspondent has sent me THIS LINK which tries to answer this question.

 Mammals had been around for as long as the dinosaurs but they led very inconspicuous lives and this may have saved them from catastrophe.

Many mammalian species became extinct; the ones that survived were small and omnivorous - the generalists.

100,000 years after the asteroid impact the first primate appeared, the interestingly named Purgatorious. From this beastie, or something like it, we are descended.

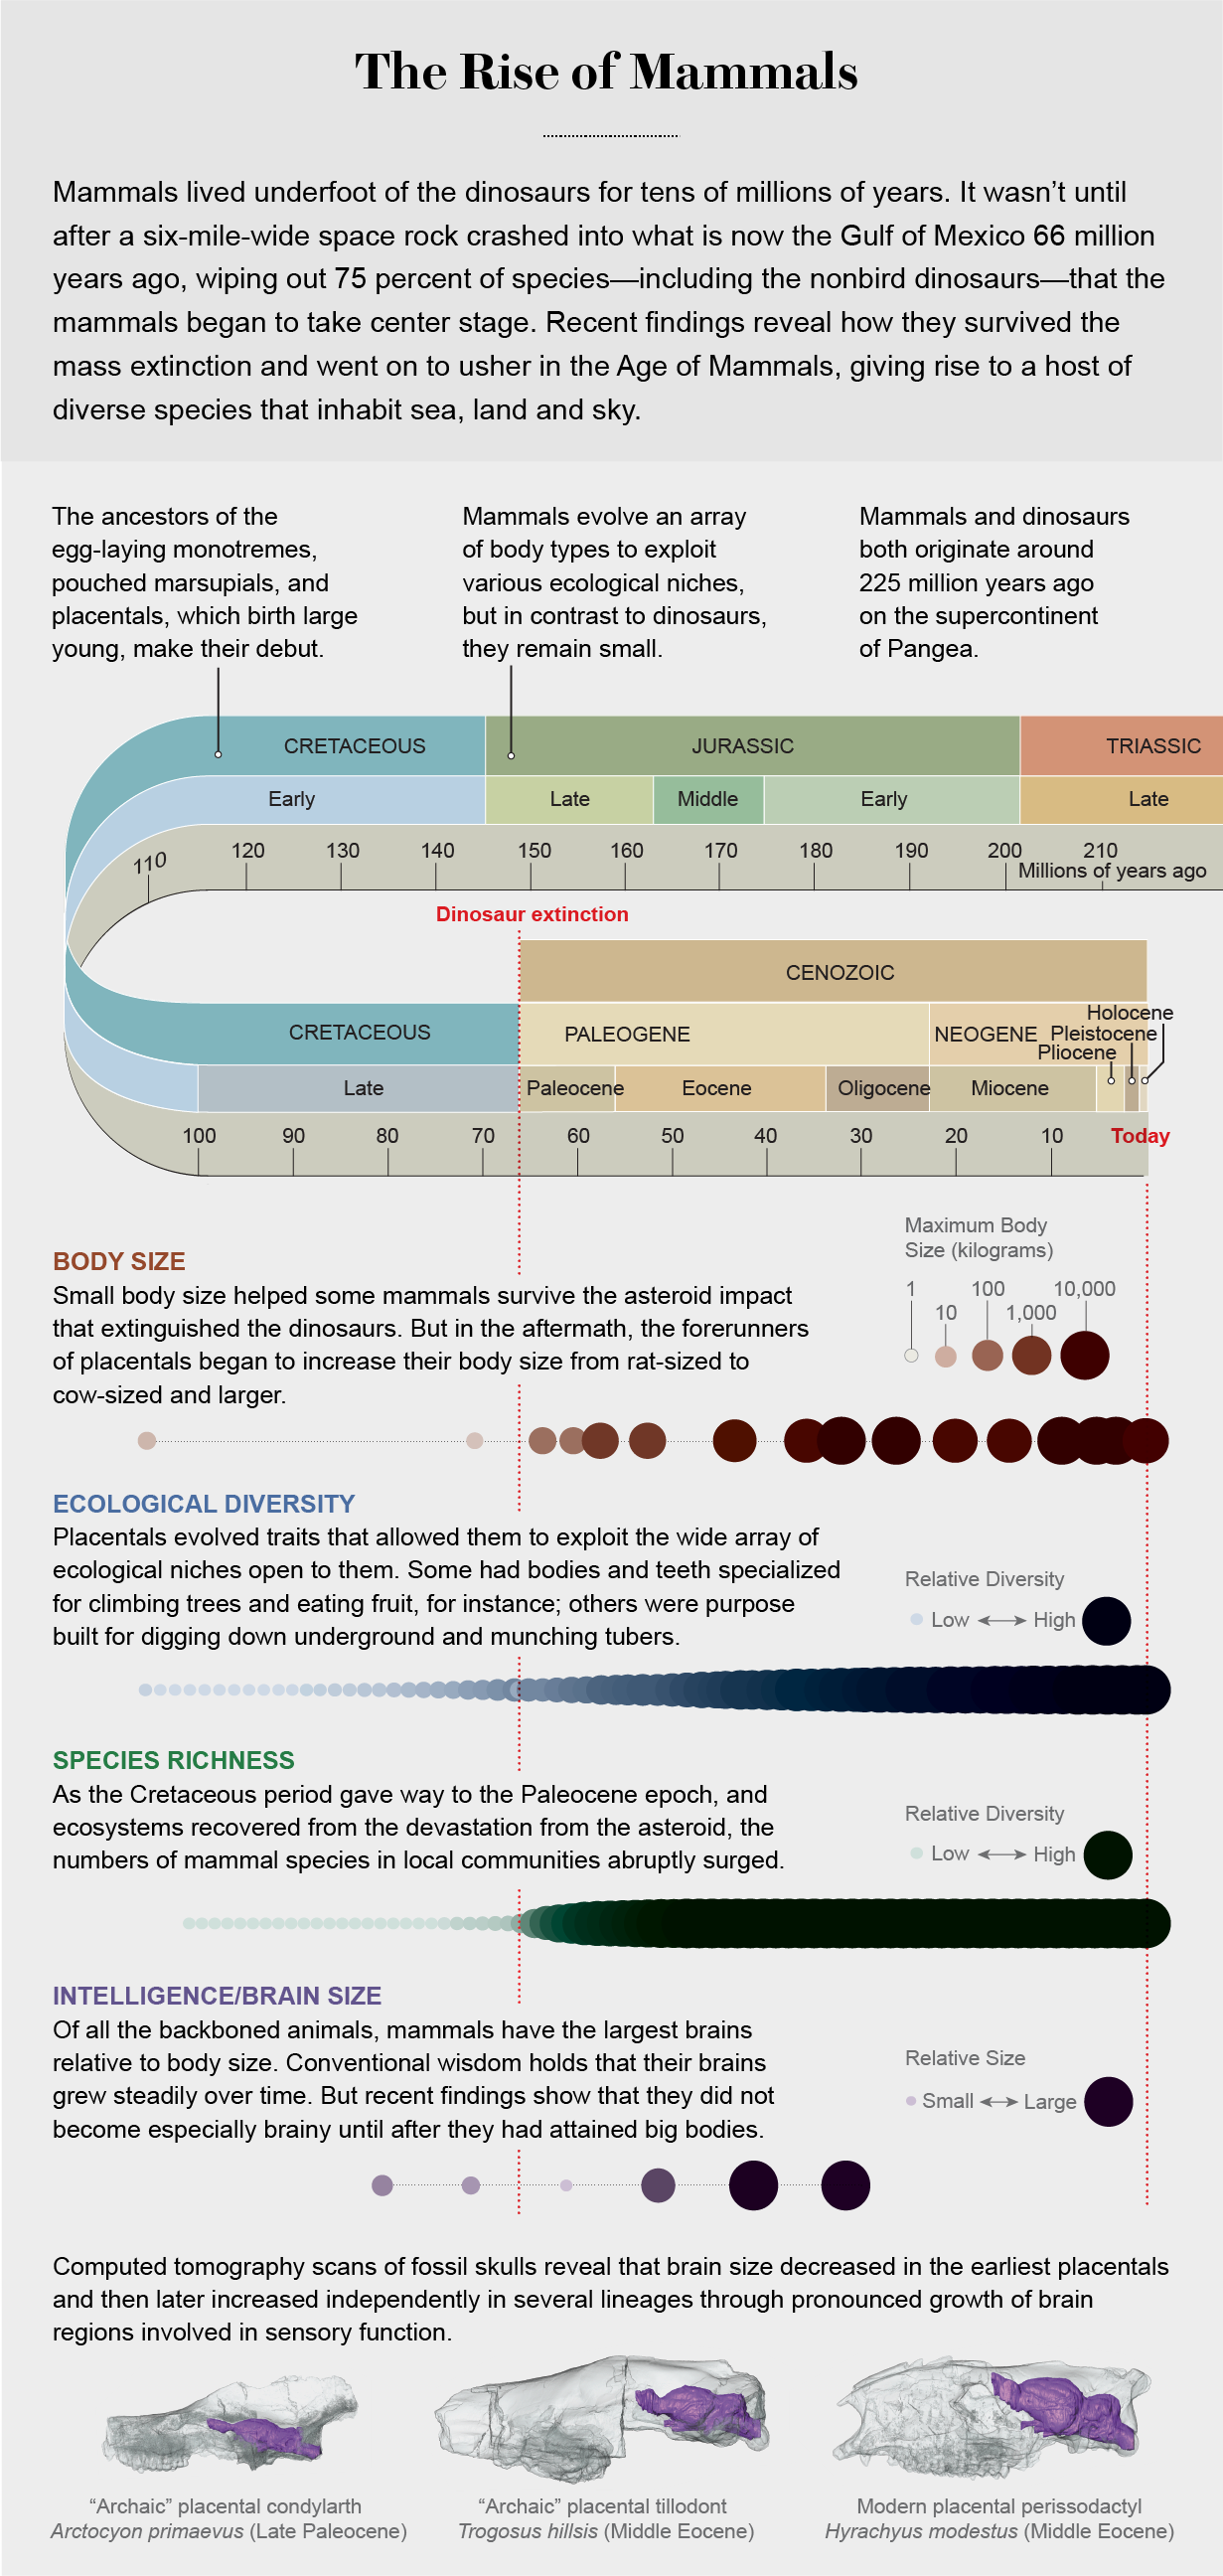
The mammals which survived the impact were small. But they did not stay small for long. They increased in size, from rat-size to cow-size, but their brains did not keep pace. They did not live by their wits. It was only later that brains started to expand.

The following diagram contains a great deal of information and does it rather elegantly. You can download a full size version HERE


Graphic by Jen Christiansen and Ornella Bertrand (brains); Sources: “The Evolution of Maximum Body Size of Terrestrial Mammals,” by Felisa A. Smith et al., in Science, Vol. 330; November 26, 2010 (body size data); “Untangling the Multiple Ecological Radiations of Early Mammals,” by David M. Grossnickle et al., in Trends in Ecology and Evolution, Vol. 34; October 2019 (ecological diversity data); “Diversity Dynamics of Phanerozoic Terrestrial Tetrapods at the Local-Community Scale,” by Roger A. Close et al., in Nature Ecology and Evolution, Vol. 3; February 2019 (species diversity data); “Brawn before Brains in Placental Mammals after the End-Cretaceous Extinction,” by Ornella C. Bertrand et al., in Science, Vol. 376; March 31, 2022 (brain size data)

Mapping the Interior of the Earth

Mapping the Interior of the Earth 

A correspondent has sent me THIS LINK. The article is based on THIS PAPER. The original authors have used seismic shear waves that diffract along the core mantle boundary to identify what they call "Ultra-Low Velocity Zones" (ULVZ); in addition they say that they can detect variability within the ULVZ. 

These ULVZ are only a few tens of kilometres high, and, being on the core mantle boundary, are very difficult to study. But high frequency waves allow them to see inside the zones.

There is a ULVZ beneath Hawaii (also, Iceland, Samoa and the Marquesas) and they postulate that they are iron enriched (possibly by interaction with the core). 

And they note that ULVZ are associated with hotspots.

There is a lot in these papers. We seem to be in a period when we are finding more and more about the Earth's interior - exciting times!

Below is a diagram illustrating the seismic techniques. I like the use of beachballs!


A Cross-section slicing the center of Hawaiian ultra-low velocity zone, showing ray paths of Sdiff waves at 96°, 100°, 110°, and 120° for 1D Earth model PREM49. The dashed lines from top to bottom mark the 410 km, 660 km discontinuity, and 2791 km (100 km above the core–mantle boundary). B Events and Sdiff ray paths on the background tomography model SEMUCB_WM1 at 2791 km depth50. Beachballs of events plotted in different colors including 20100320 (yellow), 20111214 (green), 20120417 (red), 20180910 (purple), 20180518 (brown), 20181030 (pink), 20161122 (gray), stations (triangles), and ray paths of Sdiff waves at pierce depth 2791 km in the lowermost mantle used in this study. The event used in short-period analysis is highlighted in yellow. Proposed ULVZ location is shown in black circle. Dashed line shows cross-section plotted in A.

Saturday 21 May 2022

The Huge "Blobs" in the Mantle

The Huge "Blobs" in the Mantle 

A correspondent has sent me THIS LINK which is a very approachable introduction to a topic which has appeared in this blog several times over the years.

The existence of the blobs was found by seismologists and a lot of what we know of them comes from their work. Experimental petrologists have tried to replicate the physical conditions in their laboratories.

But we still know very little about them. The article goes through the various theories. The most intriguing is that the blobs are the remnant of Theia, the planet which crashed into the Earth, producing the moon. An interesting theory, rather difficult to prove.


Friday 20 May 2022

What Did Tyrannosaurus rex Sound Like?

What Did Tyrannosaurus rex Sound Like? 

Did it roar in sufficiently scary manner? Did it's bird relationships have an affect? 

Satisfy your unquenchable curiosity by going to THIS WEB PAGE.

Thursday 12 May 2022

Down to Earth Extra May 2022

Down to Earth Extra May 2022 

The May 2022 edition of Down to Earth Extra has been published. You can get it HERE. Or you can read it below.


Get the Geological Succession on Your Phone!

Get the Geological Succession on Your Phone! 

When did the Cambrian start? How old is the base of the Llandovery? Where is the type area of the Lochkovian?

If all that gives you sleepless nights get ICS Timescale for you Apple or Android phone. It is an app and it is free.

Lots of information, easily accessible, and it looks good. Highly recommended.

Exciting Times in the Carboniferous

Exciting Times in the Carboniferous 

In the Carboniferous the UK was near the Equator. The rocks laid down indicate that sea levels changed from low to high repeatedly. And the best explanation for the cause of this is glacial maxima and interglacials, like that of the Pleistocene - but over a much longer period. 50 million years to be precise (in a geological sense - what's a couple of million years between geologists!). 340 to 290 Ma is the current estimate. In the maxima ice accumulated at the South Pole (the centre of Gondwana) and sea level fell; in the interglacials the ice melted and sea level rose.


Sedimentary evidence for global climates 320 Ma ago. As well as the large tracts of glaciogenic sediments, smaller occurrences and examples of polished rock surfaces over which ice had passed show the probable full extent (blue line) of ice sheets across the southern, Gondwana sector of Pangaea (Credit: after Fig 7.3, S104, Earth and Space, ©Open University 2007)

And then things changed. Ice-house world changed into greenhouse world. Temperatures rose and it became drier. THIS ARTICLE describes an ACADEMIC PAPER which gives an explanation for the change. Using samples from the Late Carboniferous of China, isotopes of carbon, oxygen and uranium were used to estimate the CO₂ content of the atmosphere and oxygen in the oceans. 

Between 304 and 303.5 Ma oxygen content dropped by about 30%. At about the same time the CO₂ concentration in the atmosphere doubled (350 to 700 ppm).

What caused the rise in CO₂? There is little evidence for volcanism at this time. The author of the article suggests massive burning of the coal forests of the tropics, encouraged by the high oxygen content of the atmosphere.

Rise in CO₂ results in lower oxygen in the oceans and atmosphere. The oxygen goes into changing dissolved iron (Fe²) into insoluble iron (Fe³) and the Permian has its red beds!